This evening I was looking at some Web apps to map GPX files. There's lots of different alternatives, and here's few that I like that you can choose from.
ArcGIS Online
Using the
ArcGIS.com map viewer you can quickly and easily map your GPX files. It's free to use, and free to get a public account, so you can save your maps and share them with others. Using ArcGIS Online's tools you can use the maps you make in templates, embed them in websites or blogs, share them via links, and more. It's by far the best way to map your GPX data online. You can choose from a variety of different basemaps, and also search for additional layers to add to your map from other users and the GIS community.
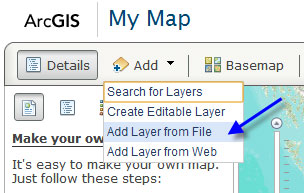
First, open a new map and click Add, then choose Add Layer from File:
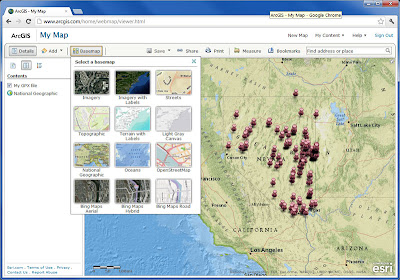
Navigate to your GPX file and select it to add it to your map. You can choose from a variety of different basemaps, change symbols, and configure the pop-up for each GPS location. Here's our GPX file shown in the ArcGIS.com map viewer:
 |
| Click to view larger image |
For more information, tune in to the
ArcGIS Online community on the
ArcGIS Blog.
GPS Visualizer
This site provides a great set of tools and options that not only let you create a quick map of your GPX data, but also provide lots of options like export (to KML or a variety of image formats), HTML generation to embed your map in a website or blog, view your data in Google Earth, and a lot more.
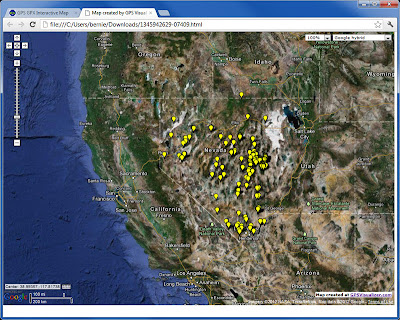
Here's the same GPX file as shown above that we exported to an HTML document. A few quick edits in Notepad and we were able to easily expand the map and change the symbols.
 |
| Click to view larger image |
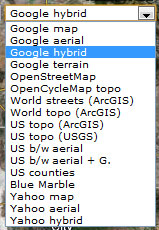
Another very nice feature are the basemap options. Everything from ArcGIS Online basemaps, to Google, to Yahoo, and others are available for you to choose from. Here's the drop-down list of available basemaps:
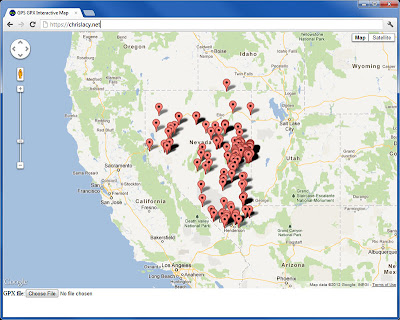
GPS GPX Interactive Map
Chris Lacy's website includes an app that provides a handy way to make a quick and easy Google map using your GPX file. Just
open his default map, click Choose at the bottom of the page, and navigate to your GPX file to create a quick Google map. The app uses the Google Maps API, and while it's not necessarily intended for saving your map or sharing it with others, it does provide a quick way to visualize your data without any fuss. Basemap options include all the Google ones; Map, Terrain, and Satellite (with and without labels).
 |
| Click to view larger image |
The above are just a few options that I've found. You can also convert your GPX file to a KML or KMZ file for use in Google Maps, ArcGIS Online, ArcGIS Explorer Desktop, ArcGIS for Desktop, and more. We'll consider some of these options in another post.